
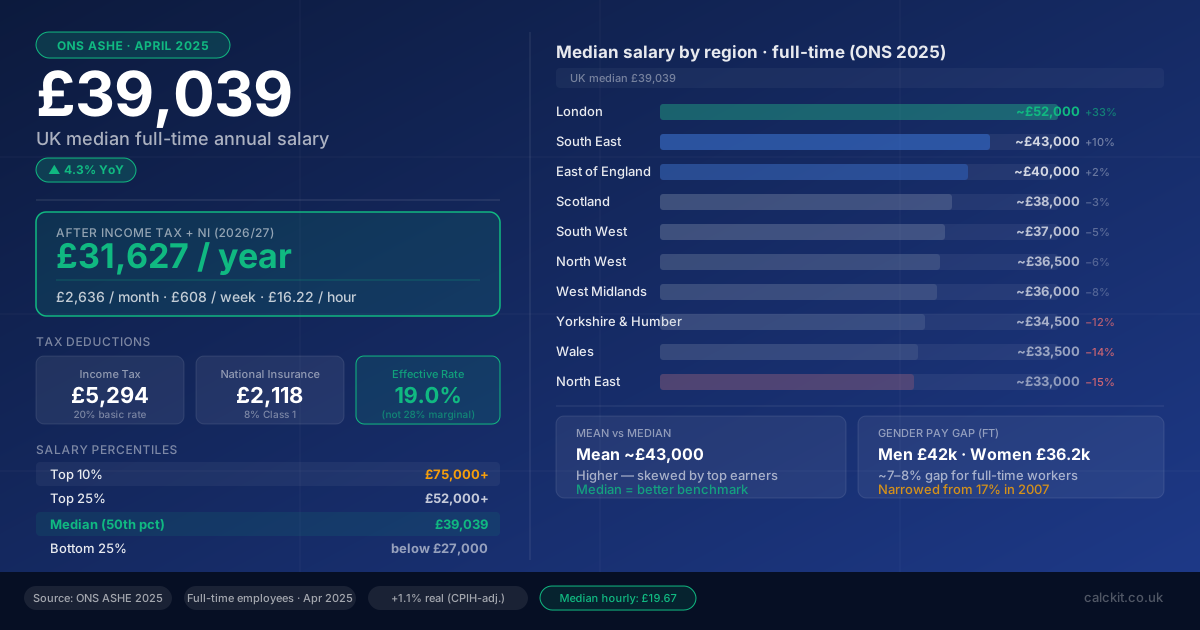
The figure most people quote for the UK average salary — £39,039 — is the median full-time salary from the ONS Annual Survey of Hours and Earnings (ASHE), published in October 2025 using April 2025 data. It is the most authoritative source available.
But the number on its own tells you nothing about what it means to earn it. This guide covers the take-home, the regional spread, what different jobs actually pay, and where your salary sits relative to everyone else.
💷What is the UK average salary in 2026?
The official figures from ONS ASHE 2025 (April 2025 data):
| Measure | Full-time | Part-time |
|---|---|---|
| Median annual earnings | £39,039 | ~£14,560 |
| Median weekly earnings | £766.60 | £280.00 |
| Median hourly earnings | £19.67 | £13.10 |
| Year-on-year change | +4.3% | +6.4% |
The ONS publishes ASHE data every October for the April of that year. The April 2026 data will be released in October 2026 — until then, £39,039 is the definitive UK benchmark.
Median vs mean — why the figures differ
You will see different "average salary" figures quoted across the internet. The difference is almost always median vs mean:
- Median (£39,039) — the midpoint of all earners, half earn above, half below. Best for comparisons.
- Mean (~£43,000) — all salaries added together and divided by the number of workers. Skewed upward by a small number of very high earners.
For most purposes, the median is the right benchmark. When a CEO earning £5 million is counted in the same average as a retail worker on £21,000, the mean becomes misleading.
Your actual take-home on the average salary
£39,039 gross salary — here is what you keep after income tax and National Insurance in 2026/27:
| Deduction | Calculation | Amount |
|---|---|---|
| Personal Allowance | £12,570 — no tax | £0 |
| Income tax | £26,469 × 20% | £5,294 |
| Employee NI | £26,469 × 8% | £2,118 |
| Total deductions | £7,412 | |
| Take-home | £39,039 − £7,412 | £31,627/yr |
That works out to:
- £2,636/month
- £608/week
- £16.22/hr (based on 37.5-hour week)
The effective income tax rate is 13.6% — not 20%. The 20% rate applies only to income above £12,570.
🕐Average salary by region
Regional earnings vary significantly across the UK. Median full-time annual salary by region (ONS ASHE 2025):
| Region | Median annual salary | vs UK median |
|---|---|---|
| London | ~£52,000 | +33% |
| South East | ~£43,000 | +10% |
| East of England | ~£40,000 | +2% |
| Scotland | ~£38,000 | −3% |
| South West | ~£37,000 | −5% |
| North West | ~£36,500 | −6% |
| West Midlands | ~£36,000 | −8% |
| East Midlands | ~£35,500 | −9% |
| Yorkshire & Humber | ~£34,500 | −12% |
| Wales | ~£33,500 | −14% |
| North East | ~£33,000 | −15% |
| Northern Ireland | ~£34,000 | −13% |
London's premium is real, but it comes with a caveat: the average two-bedroom flat in London costs over £2,000/month to rent. In Yorkshire, the equivalent is around £750–£900. After housing, the London premium largely disappears for workers below £60,000.
Average salary by occupation
The spread between highest and lowest-paid occupations is vast:
Highest-paid occupations (median full-time):
| Occupation | Approx. median salary |
|---|---|
| Surgeons and consultants | £100,000+ |
| Pilots | £90,000+ |
| IT directors / CTOs | £85,000–£100,000 |
| Financial managers | £70,000–£85,000 |
| Lawyers (solicitors) | £55,000–£80,000 |
| Software engineers (senior) | £60,000–£75,000 |
Mid-range occupations:
| Occupation | Approx. median salary |
|---|---|
| Software developer | £48,000–£55,000 |
| Accountant | £42,000–£50,000 |
| Teacher | £38,000–£45,000 |
| Police officer | £36,000–£42,000 |
| Nurse (NHS Band 5–6) | £32,000–£40,000 |
| Project manager | £42,000–£55,000 |
Lower-paid occupations:
| Occupation | Approx. median salary |
|---|---|
| Care worker | £22,000–£25,000 |
| Retail sales assistant | £20,000–£23,000 |
| Hospitality / kitchen | £21,000–£24,000 |
| Cleaner / domestic | £18,000–£22,000 |
| Warehouse operative | £23,000–£28,000 |
Gender pay gap
The UK gender pay gap for full-time employees stands at approximately 7–8% based on ONS 2025 data:
| Median annual salary | |
|---|---|
| Men (full-time) | ~£42,000 |
| Women (full-time) | ~£36,200 |
| Gap | ~£5,800 (14% of men's median) |
The gap narrows considerably when comparing like-for-like roles in the public sector — NHS and civil service pay scales are transparent and gender-neutral. The gap is widest in financial services, where men disproportionately hold senior positions.
Including part-time workers widens the gap to around 13–14%, because women are more likely to work part-time, particularly after having children. The gap has narrowed from 17% in 2007 to ~7–8% today.
📈Salary percentiles — where do you sit?
| Threshold | Annual salary | What it means |
|---|---|---|
| Top 10% | £75,000+ | 90% of workers earn less than you |
| Top 25% | £52,000+ | Upper quartile |
| Median (50th percentile) | £39,039 | Half earn more, half earn less |
| Bottom 25% | Below £27,000 | Lower quartile |
| National Living Wage (full-time) | ~£23,900 | 37.5 hrs/week at £12.21/hr |
A salary of £50,000 puts you comfortably in the top 25% nationally — though in London, £50,000 is roughly the city median.
Are real wages rising?
In short: yes, but only just. Full-time median earnings grew 4.3% in nominal terms from April 2024 to April 2025. After adjusting for CPIH inflation, real wage growth was +1.1% — a small real gain, but a gain nonetheless.
Context matters: the 2022–2024 period saw inflation run well above wage growth, eroding purchasing power. April 2025 is the second consecutive year where wages have outpaced inflation. Cumulatively, real wages are only slightly above the level before the 2022 energy price shock.
Lower-paid workers benefited most in 2024/25 — the National Living Wage rose 6.7% to £12.21/hour in April 2025, and all major low-paid occupations (caring, retail, hospitality) saw above-average nominal gains.
What counts as a good salary in the UK?
No single threshold defines "good" — it depends entirely on where you live, your household structure, and your outgoings. But some useful benchmarks:
- Above the median (£39,039): you earn more than half of UK full-time workers
- £45,000+: top third of full-time earners nationally
- £52,000+: top quarter of full-time earners (upper quartile)
- £75,000+: top 10% of earners
- £100,000+: top ~3% of earners; Personal Allowance taper begins
The most important measure is your take-home relative to your costs. A £40,000 salary in Manchester, where average rent is ~£950/month, is materially different from £40,000 in London at ~£2,100/month.
Key takeaways
- The UK median full-time salary is £39,039 (ONS ASHE, April 2025) — up 4.3% year-on-year
- After income tax and NI, that leaves £31,627/yr (£2,636/month) take-home
- The mean is higher (~£43,000) because top earners skew the average — use the median for comparisons
- London earns ~33% more than the UK median, but living costs largely cancel the premium for salaries below £60,000
- The top 25% earn above £52,000; the top 10% earn above £75,000
- Real wages grew 1.1% in 2024/25 — modestly ahead of inflation for the second consecutive year