
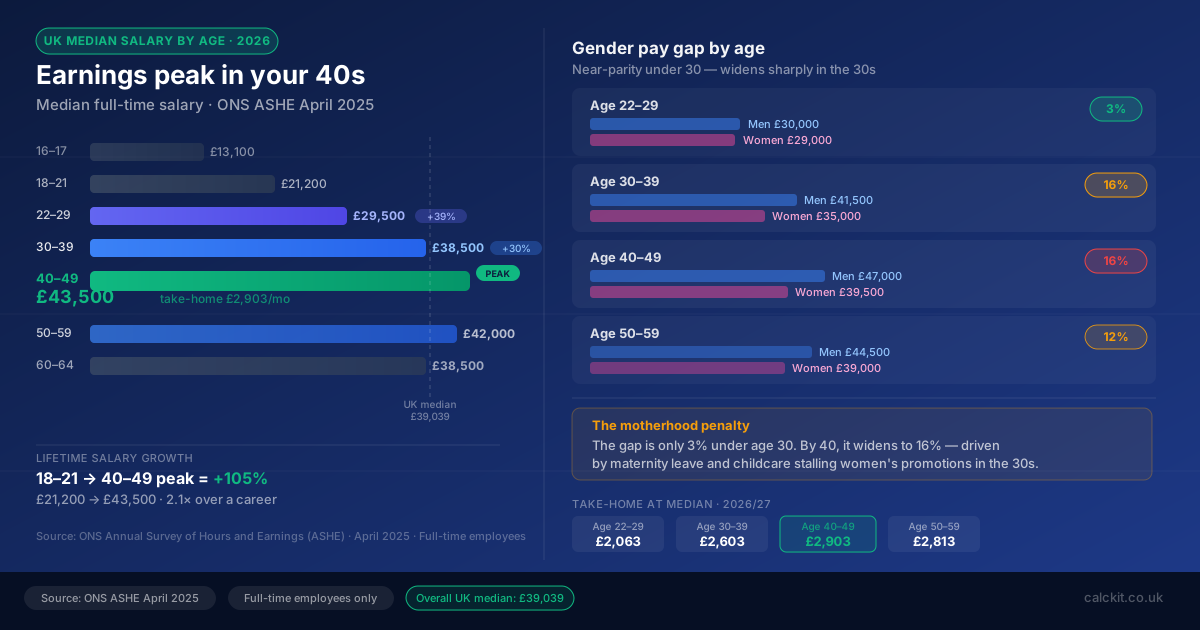
UK earnings follow a predictable curve: fast growth in your 20s, near-peak by your late 30s, peak in the 40s, then a gradual plateauing. The question most people actually want answered is not the national average — it is whether their salary is where it should be for their age.
💷UK average salary by age — full breakdown
Median full-time annual earnings by age group, ONS ASHE April 2025:
| Age group | Median salary | vs UK median (£39,039) | Take-home/month |
|---|---|---|---|
| 16–17 | ~£13,100 | −66% | ~£1,091 |
| 18–21 | ~£21,200 | −46% | ~£1,565 |
| 22–29 | ~£29,500 | −24% | ~£2,063 |
| 30–39 | ~£38,500 | −1% | ~£2,603 |
| 40–49 | ~£43,500 | +11% | ~£2,903 |
| 50–59 | ~£42,000 | +8% | ~£2,813 |
| 60–64 | ~£38,500 | −1% | ~£2,603 |
| 65+ | ~£37,000 | −5% | ~£2,498 |
Take-home figures are after income tax and National Insurance for 2026/27, assuming standard Personal Allowance (£12,570), no pension contributions or student loan.
The earnings curve — what the numbers mean
Your 20s: fastest growth, lowest base
The jump from 18–21 (£21,200) to 22–29 (£29,500) represents +39% growth — the biggest proportional leap in the entire career. Most of this is driven by:
- Moving from entry-level to established roles
- Completing degrees or apprenticeships
- First promotions and job moves
By the late 20s, many workers are approaching or passing the UK median. The 22–29 band still sits 24% below the UK median — a gap that closes fast in the 30s for most occupations.
Your 30s: closing the gap
The jump from 22–29 to 30–39 adds roughly £9,000 (+30% nominal). Workers in their 30s who are progressing normally should be near or slightly above the UK median of £39,039. If you are significantly below your age-group median by age 35, it is worth comparing job-market rates — the gap tends to compound over time.
This is also the decade when the gender pay gap begins to widen (see below).
Your 40s: peak earnings
The 40–49 group has the highest median at ~£43,500 — about 11% above the national median. This reflects:
- Many workers reaching senior/management roles
- Accumulated experience commanding premium rates
- Survivors of career selection (lower earners may have left full-time work)
Peak earnings in the 40s are roughly 2.1× the median for 18–21-year-olds.
Your 50s onward: gradual plateau
Median earnings dip only slightly from the 40s to the 50s (~£43,500 → ~£42,000). The 60–64 group sees a sharper fall to ~£38,500, partly because:
- Some workers step back voluntarily from senior roles
- More flexible/part-time transitions appear in this band
- Redundancy at 50+ can mean restarting at a lower level
Take-home pay at each age median
A salary number tells you nothing until you know what you keep. Here is the after-tax reality at each age group's median:
| Age group | Gross | Income tax | NI | Take-home/yr | Take-home/mo |
|---|---|---|---|---|---|
| 18–21 | £21,200 | £1,726 | £690 | £18,784 | £1,565 |
| 22–29 | £29,500 | £3,386 | £1,354 | £24,760 | £2,063 |
| 30–39 | £38,500 | £5,186 | £2,074 | £31,240 | £2,603 |
| 40–49 | £43,500 | £6,186 | £2,474 | £34,840 | £2,903 |
| 50–59 | £42,000 | £5,886 | £2,354 | £33,760 | £2,813 |
| 60–64 | £38,500 | £5,186 | £2,074 | £31,240 | £2,603 |
The effective total tax rate (income tax + NI as a % of gross) ranges from 11.4% at £21,200 to 19.7% at £43,500 — never the headline 28% people often fear.
Gender pay gap by age
The gap is near-parity in the 20s and widens significantly from the 30s:
| Age group | Men (median) | Women (median) | Gap |
|---|---|---|---|
| 22–29 | ~£30,000 | ~£29,000 | ~3% |
| 30–39 | ~£41,500 | ~£35,000 | ~16% |
| 40–49 | ~£47,000 | ~£39,500 | ~16% |
| 50–59 | ~£44,500 | ~£39,000 | ~12% |
Why the gap widens at 30–39
The primary driver is the motherhood penalty. Women who take maternity leave and then reduce hours for childcare miss out on promotions and performance reviews during the same years men are advancing. ONS data consistently shows that:
- Women's real earnings growth stalls or reverses in the 30–39 band
- Men's earnings growth in the same band is the fastest of their career
- The gap that opens between 30 and 40 rarely closes, even once children are in secondary school
Shared Parental Leave (SPL) was introduced to address this, but uptake remains low — around 3–4% of eligible fathers in the UK use it.
The gap narrows slightly in the 50s, partly because some higher-earning men take early retirement or shift to non-executive roles.
📈Is my salary good for my age?
Use these benchmarks to position yourself within your age group:
22–29
| Threshold | Salary | What it means |
|---|---|---|
| Top 25% | £40,000+ | Strong start — above many mid-career workers |
| Median | ~£29,500 | In line with peers |
| Bottom 25% | Below £22,000 | Below age-group median — consider switching roles/sectors |
30–39
| Threshold | Salary | What it means |
|---|---|---|
| Top 25% | £52,000+ | Senior/specialist level |
| Median | ~£38,500 | On track — at the UK national median |
| Bottom 25% | Below £28,000 | Significantly below age median — sector or location may be limiting growth |
40–49
| Threshold | Salary | What it means |
|---|---|---|
| Top 25% | £62,000+ | Senior management or specialist premium |
| Median | ~£43,500 | At or near peak national median |
| Bottom 25% | Below £31,000 | Below the national median for this peak-earning age band |
How to move faster along the curve
The age-salary data shows norms, not ceilings. Several levers can accelerate progression at any stage:
In your 20s:
- Job-hopping typically delivers 15–25% pay increases vs 3–5% in-role raises
- Specialising early (cloud, AI, finance, law) pays a premium over generalist roles
- Graduate schemes often compress the 22–25 pay ramp significantly
In your 30s:
- The highest ROI action is negotiating on every job offer — most UK employers expect negotiation but only ~30% of candidates attempt it
- Pension sacrifice can effectively increase take-home by reducing tax, particularly if you are approaching £50,270
- If you have taken a career break, re-entry via returnships or contract work can recapture lost ground faster than permanent roles
In your 40s and beyond:
- Consultancy or contract work typically pays 30–50% more than equivalent permanent roles for the same seniority
- Non-executive directorships and advisory roles are common income supplements for senior professionals
- If earnings have stalled, a sector move (e.g. public sector → private sector) often resets the salary ceiling
Key takeaways
- UK median full-time earnings by age range from ~£21,200 (18–21) to a peak of ~£43,500 (40–49)
- Peak earnings come in your 40s — about 11% above the national median of £39,039
- The fastest proportional growth is in your 20s (+39% from early to late 20s)
- The 30s decade carries the widest gender pay gap divergence — maternity and childcare are the primary drivers
- Take-home at the 40s peak (£43,500) is £2,903/month — the effective tax rate is 19.7%, not 28%
- Whether your salary is "good for your age" depends heavily on sector, location, and whether you actively negotiate