
Your GP took your blood pressure and said it was "a bit high." A pharmacist's machine printed a reading you can't interpret. Or your home monitor gave you 138/88 at 55, and you're not sure whether to worry.
The problem isn't the number — it's the context. A 138/88 reading at 25 sits in a different risk bracket from the same reading at 55. Most chart resources give you the NHS bands without age context, or show you a table without explaining what to do with it.
This guide gives you both: the complete NHS blood pressure chart with every mmHg threshold, UK average readings by age and gender, pregnancy ranges, and a practical protocol for tracking your readings at home.
🩺The NHS Blood Pressure Chart: All Categories
The NHS categorises blood pressure into five bands. The thresholds below are for clinic readings — if you monitor at home, the hypertension threshold is lower (see the note after the table).
| Category | Systolic (mmHg) | Diastolic (mmHg) | What it means | |
|---|---|---|---|---|
| Low (hypotension) | Below 90 | and/or | Below 60 | May cause dizziness or fainting |
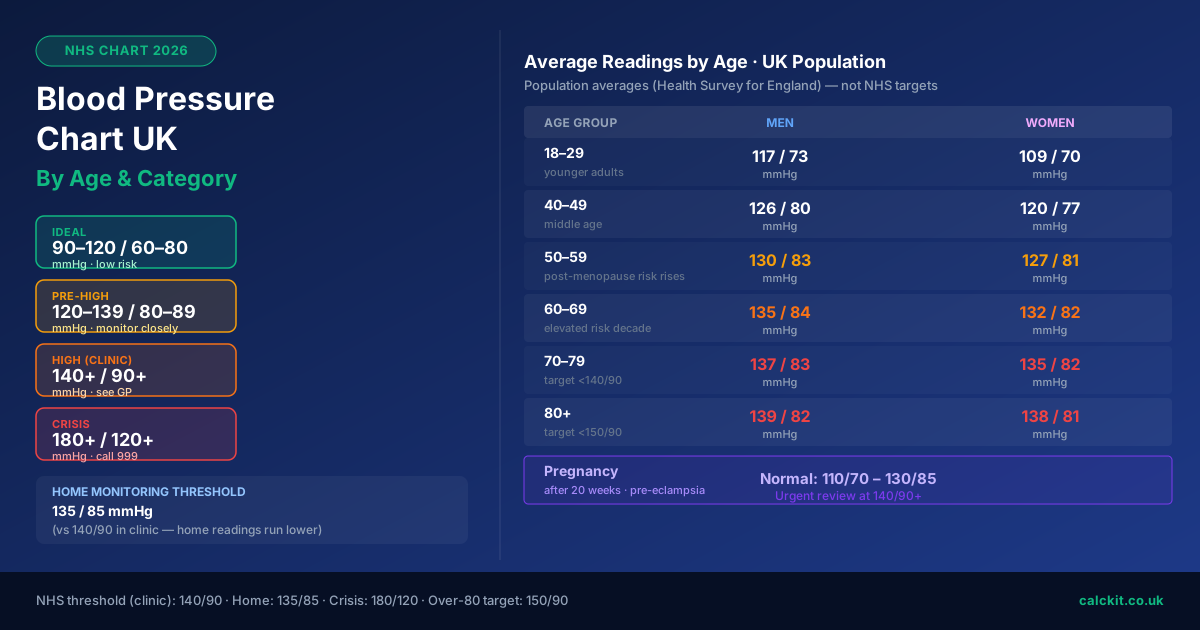
| Ideal | 90–120 | and | 60–80 | Healthy range — low cardiovascular risk |
| Pre-high (elevated) | 120–139 | or | 80–89 | Monitor regularly; lifestyle changes recommended |
| High — Stage 1 | 140–160 | or | 90–100 | Hypertension — GP assessment needed |
| High — Stage 2 | 160–180 | or | 100–110 | Persistent high — treatment usually required |
| Hypertensive crisis | 180+ | or | 120+ | Medical emergency — call 999 or go to A&E |
Clinic vs home threshold: The clinic threshold for high blood pressure is 140/90 mmHg. At home, it is 135/85 mmHg — home readings run a few mmHg lower because there's no anxiety-related "white coat" effect in your own environment. The same reading means something different depending on where it was taken.
A reading is classified by whichever number is higher. So 136/95 falls into Stage 1 because the diastolic (95) exceeds 90, even though the systolic is under 140.
Blood Pressure Chart by Age UK: Population Averages
Blood pressure rises naturally with age. The figures below are UK population averages based on Health Survey for England data — they are not NHS targets. The NHS treatment threshold is 140/90 mmHg (clinic) for all adults under 80, regardless of age.
| Age group | Men — avg systolic/diastolic | Women — avg systolic/diastolic |
|---|---|---|
| 18–29 | 117 / 73 mmHg | 109 / 70 mmHg |
| 30–39 | 121 / 76 mmHg | 114 / 73 mmHg |
| 40–49 | 126 / 80 mmHg | 120 / 77 mmHg |
| 50–59 | 130 / 83 mmHg | 127 / 81 mmHg |
| 60–69 | 135 / 84 mmHg | 132 / 82 mmHg |
| 70–79 | 137 / 83 mmHg | 135 / 82 mmHg |
| 80+ | 139 / 82 mmHg | 138 / 81 mmHg |
Men run higher in younger decades. Men typically have higher blood pressure than women from their 20s through to their 50s. That gap narrows significantly around menopause, when the protective cardiovascular effect of oestrogen declines. By their 60s, women's readings approach — and sometimes exceed — men's.
Diastolic peaks, then plateaus. Systolic pressure rises steadily throughout life. Diastolic pressure tends to peak in the 50s and then level off or slightly fall in older adults. This explains why isolated systolic hypertension (high top number, normal bottom number) becomes more common in the over-60s.
These are averages across healthy and unhealthy individuals. Your actual reading will be influenced by genetics, salt intake, physical activity, weight, medication, and other factors.
NHS Blood Pressure Treatment Targets by Age
Population averages and treatment targets are different things. The NHS targets that guide when medication is typically started are:
| Age group | Clinic target | Home / ABPM target |
|---|---|---|
| All adults under 80 | Below 140 / 90 mmHg | Below 135 / 85 mmHg |
| Adults aged 80 and over | Below 150 / 90 mmHg | Below 145 / 85 mmHg |
| Under 80 with diabetes or high cardiovascular risk | Below 130 / 80 mmHg | Below 130 / 80 mmHg |
The slightly relaxed 80+ target reflects evidence that aggressive blood pressure lowering in older adults can increase fall and fracture risk. It is not a licence to leave high blood pressure untreated — 150/90 is still a treatment threshold, not a normal reading.
⚕️Blood Pressure Chart During Pregnancy
Pregnancy changes blood pressure. Readings typically dip slightly in the first and second trimesters — as blood volume expands and blood vessels relax — then return toward pre-pregnancy levels in the third trimester.
| Stage | Normal range | When to call your midwife |
|---|---|---|
| First trimester (0–12 weeks) | 100/60 – 120/80 mmHg | Below 90/60 with dizziness |
| Second trimester (13–26 weeks) | 100/65 – 120/80 mmHg | 140/90 or above |
| Third trimester (27–40 weeks) | 105/70 – 130/85 mmHg | 140/90 or above |
A reading of 140/90 mmHg or above after 20 weeks may indicate pre-eclampsia — a serious condition that requires same-day review. Readings of 160/110 mmHg or above in pregnancy are classified as severe pre-eclampsia and need immediate hospital attendance.
Pregnancy tip: If your home reading reaches 140/90 at any point after 20 weeks, call your maternity unit immediately — do not wait for your next scheduled appointment.
Why Blood Pressure Rises With Age
The upward progression in the age chart above is not random. Three mechanisms drive it:
Arterial stiffness. Young, healthy arteries flex with each heartbeat, absorbing pressure like a balloon. Over decades, the elastic fibres in artery walls break down and are replaced by stiffer collagen. Each heartbeat drives a sharper pressure spike — raising systolic in particular.
Declining kidney efficiency. Kidneys regulate blood pressure by controlling fluid and sodium balance. Gradual age-related kidney function decline means less efficient sodium excretion, contributing to higher baseline pressure over time.
Hormonal changes. In women, falling oestrogen at menopause removes a protective effect on blood vessel walls — explaining why women's readings catch up with men's from the 50s onwards. In men, the relationship between testosterone and blood pressure is more complex and multifactorial.
The critical takeaway: these mechanisms can be meaningfully slowed by lifestyle, but they cannot be fully stopped. High salt intake, physical inactivity, obesity, and smoking all accelerate arterial ageing. Diet, regular exercise, and maintaining a healthy weight all slow it — often by 10–15 years in terms of vascular age.
How to Track Your Blood Pressure at Home
A single reading is a snapshot. A pattern over days is what matters — both for your own awareness and for what your GP needs.
Equipment
Use a validated upper-arm monitor. Wrist cuffs are less accurate because reading quality is sensitive to wrist position and angle. The British and Irish Hypertension Society (BIHS) maintains a list of validated devices at bihsoc.org — a model on that list is a reliable baseline choice.
The NHS Home Monitoring Protocol
7-day home monitoring protocol (NHS/NICE)
- Sit quietly for 5 minutes before measuring
- Sit with back supported, feet flat, arm resting at heart height
- Take 2 readings, 1 minute apart — record both
- Repeat morning and evening each day
- Monitor for 7 days
- Discard Day 1 readings (first-day readings are often elevated)
- Your GP uses the average of Days 2–7 for assessment
What to note
A simple log captures: date, time, both readings, and brief context (post-exercise, stressed, after coffee). Context matters. A 148/92 reading taken 20 minutes after a stressful commute tells a different story from three consecutive calm-morning readings of 148/92.
💧Red Lines at Every Age: When to Act
These action thresholds apply regardless of your age:
| Reading | What to do |
|---|---|
| Below 90/60 | Discuss with GP if symptomatic (dizziness, fainting, fatigue) |
| 120/80–139/89 | Monitor annually or every 2 years; consider lifestyle changes |
| 140/90–159/99 | See GP within 4 weeks (confirmed on repeat reading) |
| 160/100–179/109 | See GP urgently — aim for within 1 week |
| 180/110–179/119 | Contact GP or call NHS 111 same day |
| 180/120 or above | Call 999 or go to A&E immediately |
Symptoms that upgrade urgency at any reading: chest pain, shortness of breath, severe or sudden headache, vision changes, sudden weakness or confusion. These symptoms alongside any elevated reading warrant a 999 call.
Factors That Move You Along the Chart
Blood pressure is not fixed. These lifestyle factors shift readings measurably:
| Factor | Typical effect on systolic |
|---|---|
| Reducing salt intake to 6g/day | −4 to −5 mmHg |
| 150+ min moderate exercise per week | −4 to −8 mmHg |
| Losing 5 kg body weight | −4 to −5 mmHg |
| DASH or Mediterranean diet | −3 to −6 mmHg |
| Reducing alcohol to 14 units/week | −2 to −4 mmHg |
| Stopping smoking | Reduces cardiovascular risk; short-term effects vary |
These reductions are additive. Someone with a systolic of 148 who reduces salt, starts exercising, and loses 5 kg could see a combined drop of 12–18 mmHg — enough to move from Stage 1 hypertension back into the pre-high range without medication.
A sustained 5 mmHg reduction in systolic pressure is associated with approximately a 10% reduction in major cardiovascular events (heart attack, stroke) at a population level.
For a full explanation of what each blood pressure category means and the complete NHS treatment pathway — from lifestyle advice to medication steps — see the blood pressure ranges guide.
For a technical deep-dive into what the two numbers actually represent — including pulse pressure, ABPM, and white coat hypertension — see the blood pressure readings explained guide.
A high BMI is one of the strongest modifiable risk factors for elevated blood pressure. Use the BMI calculator to check your BMI and the resting heart rate guide for the broader cardiovascular picture.
Key Chart Rules at a Glance
- Ideal: 90–120 / 60–80 mmHg
- Clinic high: 140/90+ — get assessed
- Home high: 135/85+ — equivalent threshold for home monitoring
- Crisis: 180/120+ — immediate medical attention
- 80+ treatment target: 150/90 (slightly relaxed to reduce fall risk)
- Pregnancy: 140/90+ after 20 weeks — call your maternity unit same day
- Population averages rise with age — but the treatment target stays at 140/90 until age 80
Last updated October 2026. NHS blood pressure thresholds from NICE guideline NG136 (updated 2023) and NHS.uk (last reviewed July 2024). Population averages based on Health Survey for England data. For personal medical advice, consult your GP or a qualified healthcare professional.