
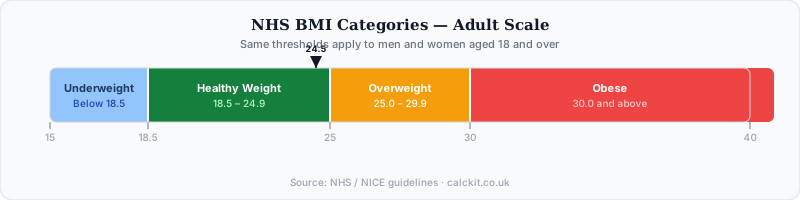
A healthy BMI in the UK is between 18.5 and 24.9 according to NHS guidelines. Below 18.5 is underweight. Between 25 and 29.9 is overweight. 30 and above is obese. If you are of South Asian or Chinese background, those thresholds are lower — overweight starts at 23, obese at 27.5.
That is the short answer. This article explains what those numbers mean, shows you the full UK BMI chart by height, and tells you what to actually do with your result.
⚕️The NHS BMI Formula
BMI stands for Body Mass Index. Your body mass index (BMI) is a single number calculated from your weight and height.
BMI = Weight (kg) ÷ Height (m)²
Example: You weigh 75kg and are 1.75m tall.
- Height squared: 1.75 × 1.75 = 3.0625
- BMI: 75 ÷ 3.0625 = 24.5
A BMI of 24.5 falls in the healthy range. The calculator above does this instantly — you do not need to work it out by hand.
Using imperial measurements? Convert to metric first: 1 stone = 6.35kg, 1 inch = 2.54cm. Or use the imperial toggle in the calculator.
UK BMI Categories — NHS Weight Ranges
The NHS uses four categories for adults aged 18 and over:
| BMI | Category | Health Risk |
|---|---|---|
| Below 18.5 | Underweight | Nutritional deficiency, bone loss, immune issues |
| 18.5 – 24.9 | Healthy weight | Lowest risk range |
| 25.0 – 29.9 | Overweight | Moderate increased risk |
| 30.0 – 34.9 | Obese (Class I) | High risk |
| 35.0 – 39.9 | Obese (Class II) | Very high risk |
| 40.0 and above | Obese (Class III) | Extremely high risk |
The NHS officially uses four categories (not six), but distinguishes Class I, II, and III obesity in clinical practice. For most adults, knowing whether you fall into healthy, overweight, or obese is the starting point.
BMI Below 18.5 — The NHS Underweight Threshold
The NHS classifies a BMI below 18.5 as underweight for adults aged 18 and over. This applies to both men and women — the threshold is the same regardless of sex.
Weight at the 18.5 threshold by height
| Height | BMI 18.5 (underweight boundary) |
|---|---|
| 5'0" (152cm) | 43kg (6st 11lb) |
| 5'2" (157cm) | 46kg (7st 3lb) |
| 5'4" (163cm) | 49kg (7st 10lb) |
| 5'6" (168cm) | 52kg (8st 3lb) |
| 5'8" (173cm) | 55kg (8st 9lb) |
| 5'10" (178cm) | 59kg (9st 4lb) |
| 6'0" (183cm) | 62kg (9st 11lb) |
| 6'2" (188cm) | 65kg (10st 3lb) |
If you weigh less than the figure shown for your height, your BMI is below 18.5 and the NHS considers you underweight.
Health risks of being underweight (BMI below 18.5)
Being underweight is not automatically dangerous, but a BMI below 18.5 — particularly if you have lost weight without trying — carries real health risks:
- Nutritional deficiencies — iron, vitamin B12, vitamin D, and folate are most common
- Reduced bone density — higher risk of fractures and osteoporosis, especially in women
- Weakened immune system — more frequent infections and slower recovery
- Hormonal disruption — in women, periods may become irregular or stop entirely
- Muscle weakness and fatigue — the body draws on muscle tissue for energy when calorie intake is insufficient
If your BMI is below 17.5, clinical guidelines consider this a potential indicator of an eating disorder and prompt referral to specialist support.
When to see your GP
Speak to your GP if:
- Your BMI has dropped below 18.5 unexpectedly (without deliberate dieting)
- You have lost more than 5% of your body weight in the last 6–12 months without trying
- You have symptoms alongside low weight — fatigue, frequent illness, hair thinning, or bone pain
Even if your BMI has always been below 18.5, a one-off conversation with your GP is worthwhile. A GP can assess whether you need nutritional support, check for underlying causes, and refer you to appropriate services if needed.
For children and young people under 18, do not use the adult 18.5 threshold. Child BMI is plotted against age- and sex-adjusted centile charts. Use our child growth chart calculator for anyone under 18.
UK BMI Chart by Height
This NHS weight chart shows the weight ranges for a healthy BMI (18.5–24.9) at common heights. Use it as a quick reference.
| Height | Underweight (below 18.5) | Healthy Weight (18.5–24.9) | Overweight (25–29.9) | Obese (30+) |
|---|---|---|---|---|
| 5'0" (152cm) | Below 43kg | 43–57kg | 58–69kg | 70kg+ |
| 5'2" (157cm) | Below 46kg | 46–61kg | 62–73kg | 74kg+ |
| 5'4" (163cm) | Below 49kg | 49–66kg | 67–80kg | 81kg+ |
| 5'6" (168cm) | Below 52kg | 52–70kg | 71–84kg | 85kg+ |
| 5'8" (173cm) | Below 55kg | 55–74kg | 75–89kg | 90kg+ |
| 5'10" (178cm) | Below 59kg | 59–79kg | 80–94kg | 95kg+ |
| 6'0" (183cm) | Below 62kg | 62–83kg | 84–100kg | 101kg+ |
| 6'2" (188cm) | Below 65kg | 65–88kg | 89–105kg | 106kg+ |
Weights are rounded to the nearest kg. For a precise result, use the BMI calculator.
Ethnicity-Adjusted BMI Thresholds
The standard NHS thresholds (18.5 / 25 / 30) were developed using data primarily from European populations. Research has since shown that people of South Asian, Chinese, and some Black African backgrounds carry higher health risks at lower BMI values — typically because of differences in where fat is stored (more visceral fat, less subcutaneous fat) at the same BMI.
The NHS now recommends lower action thresholds for these groups:
| Background | Overweight starts at | Obese starts at |
|---|---|---|
| White, Black African, Black Caribbean, Mixed | BMI 25 | BMI 30 |
| South Asian (Indian, Pakistani, Bangladeshi, Sri Lankan) | BMI 23 | BMI 27.5 |
| Chinese | BMI 23 | BMI 27.5 |
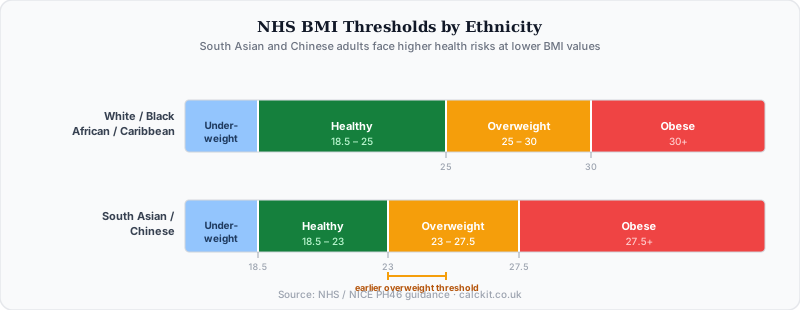
If you are of South Asian or Chinese background and your BMI is between 23 and 24.9, the NHS considers you in the overweight category — even though the standard chart shows healthy. Use the correct threshold for your background when interpreting your result.
Does BMI Differ for Women and Men?
The NHS uses the same BMI scale for women and men. The healthy range (18.5–24.9) applies to both sexes.
In practice, women naturally carry more body fat than men at the same BMI — approximately 5–8 percentage points higher at any given BMI value. A woman with a BMI of 22 and a man with a BMI of 22 have very different body compositions. The NHS acknowledges this limitation but uses a single scale because it is simple, consistent, and still useful at a population level.
If you want a more body composition-specific measurement, waist circumference (covered below) is a useful addition.
Does Healthy BMI Change with Age?
For adults aged 18–64, the thresholds are fixed at 18.5/25/30.
For adults aged 65 and over, the picture is more nuanced. Research suggests that a slightly higher BMI (22–26) may be protective in older adults — lower mortality risk, better recovery from illness, and greater muscle mass reserves. Some clinical guidelines recommend not using the same underweight threshold for older adults, and GPs often use clinical judgement alongside BMI when assessing older patients.
For children and young people, the standard adult BMI scale does not apply at all. BMI in children is plotted against age-and-sex-specific reference charts because children's healthy weight ranges change as they grow.
If you are checking a child's height and weight, use our child growth chart calculator instead. It plots results against UK centile charts for ages 0–18.
BMI and Waist Circumference — Use Both
BMI tells you whether your weight is in a healthy range for your height. It does not tell you where that weight is stored. Fat carried around the abdomen (visceral fat) is more directly linked to type 2 diabetes and heart disease than fat stored around the hips and thighs.
The NHS recommends measuring your waist as well as calculating your BMI. Measure around the middle — at the narrowest point between your lower ribs and your navel, after breathing out normally.
| Waist Size | Risk Level |
|---|---|
| Men: below 94cm (37in) | Low risk |
| Men: 94–102cm (37–40in) | Increased risk |
| Men: above 102cm (40in) | High risk |
| Women: below 80cm (31.5in) | Low risk |
| Women: 80–88cm (31.5–34.5in) | Increased risk |
| Women: above 88cm (34.5in) | High risk |
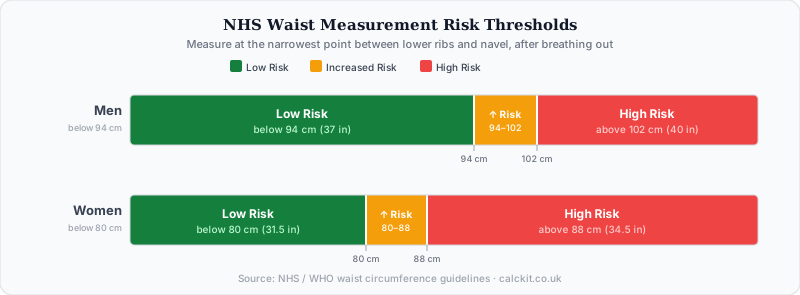
A person with a normal BMI but a high waist measurement still carries elevated health risk. A person with a slightly elevated BMI but a normal waist measurement may have less risk than their BMI alone suggests. Using both gives a more complete picture.
The Limitations of BMI
BMI is a population-level screening tool. It is useful, widely used, and quick to calculate. It is not a precise measure of individual health.
Muscle mass: BMI cannot distinguish between fat and muscle. A rugby player or weightlifter may have a BMI of 28 and low body fat. The calculator would flag them as overweight. This is the most commonly cited limitation.
Body fat distribution: Two people with identical BMIs can have very different distributions of fat — one carrying it subcutaneously (under the skin), one viscerally (around the organs). The latter is significantly more dangerous.
Age: As noted above, the same BMI thresholds are less useful for older adults.
Ethnicity: Standard thresholds underestimate risk for South Asian and Chinese populations, as covered above.
For most people without extreme muscle mass, BMI is a reasonable first indicator. The NHS uses it because it is standardised, reproducible, and accessible without clinical equipment. But a GP assessing your health will also consider blood pressure, blood glucose, cholesterol, waist measurement, and clinical history — not BMI alone.
What to Do With Your Result
If your BMI is below 18.5 (underweight):
Being underweight carries real health risks — reduced bone density, weaker immune response, nutritional deficiencies, and in women, disrupted hormonal cycles. See your GP, especially if you have lost weight unintentionally. For most people, the goal is gradual weight gain through increased calorie intake and, where appropriate, strength training to build muscle alongside fat mass.
If your BMI is 18.5–24.9 (healthy weight):
Maintaining this range reduces your risk of weight-related conditions. Your focus should be on what you eat and your activity level — not the number itself. A BMI at the lower end of healthy (18.5–21) with low physical activity is often less healthy in practice than a BMI of 24 with regular exercise.
If your BMI is 25–29.9 (overweight):
A BMI in this range increases risk, but modestly. For many people, the most effective initial steps are: reducing ultra-processed food intake, increasing daily steps (aim for 7,000–10,000), staying properly hydrated (see how much water you should drink a day), and improving sleep quality. Even a 5% reduction in body weight produces measurable improvements in blood pressure, blood glucose, and cholesterol. You do not need to reach BMI 24.9 to see health benefits.
If your BMI is 30 or above (obese):
Speak to your GP. At this range, lifestyle changes remain the most effective intervention — but many people benefit from structured support. Your GP can refer you to NHS weight management services, which offer dietary guidance, physical activity support, and in some cases medical options. The NHS also offers the Healthier Weight programme for those with a BMI of 30 or above.
🔥How to Reach a Healthy BMI
A BMI reduction of 1 point requires losing roughly 2–3kg for most adults (depending on height). Moving from a BMI of 27 to 24.9 might require losing 5–8kg.
The sustainable rate of weight loss is 0.5–1kg per week — faster rates tend to result in muscle loss and are harder to maintain. At 0.5kg per week, a 6kg loss takes about 12 weeks.
The calorie deficit required: approximately 500 kcal/day produces roughly 0.5kg/week of weight loss. Your exact calorie needs depend on age, sex, height, weight, and activity level.
🔥Frequently Asked Questions
What BMI is underweight in the UK?
A BMI below 18.5 is classed as underweight by the NHS for most adults. Below 18.5 is underweight, 18.5–24.9 is a healthy weight, 25–29.9 is overweight, and 30 or above is obese. If your BMI is under 18.5 — especially after unintentional weight loss — speak to your GP, as being underweight carries risks including reduced bone density, weaker immunity, and nutritional deficiencies.
Is a BMI under 18.5 unhealthy?
A BMI under 18.5 means you are underweight, which can carry health risks such as nutritional deficiencies, bone loss, a weakened immune system, and in women disrupted hormonal cycles. It is not automatically dangerous — some people are naturally lean — but a BMI below 18.5, particularly if your weight has dropped without trying, is worth discussing with your GP.
What BMI is overweight in the UK?
For most adults, overweight starts at BMI 25. For South Asian and Chinese adults, it starts at BMI 23. Obese starts at BMI 30 for most adults and 27.5 for South Asian and Chinese adults.
Is BMI 25 overweight?
Yes, technically. A BMI of 25 is the first point on the overweight scale. However, context matters — a muscular person with a BMI of 25 and low body fat is not in the same risk category as a sedentary person with the same BMI. Waist measurement and body composition provide additional context.
What BMI is considered healthy for a woman in the UK?
The NHS healthy range is 18.5–24.9, the same for women and men. Women naturally carry more body fat at any given BMI value, but the NHS does not use different thresholds by sex.
What is a normal BMI for a 50-year-old?
The standard healthy range (18.5–24.9) applies. However, at 50 and above, muscle mass naturally decreases and fat mass tends to increase — so a BMI in the lower-normal range (18.5–21) with low physical activity is not necessarily healthier than a BMI of 23–24 with good muscle mass and activity.
Is BMI accurate?
BMI is a reasonable population-level screening tool. It is less accurate for individuals with high muscle mass, older adults, and people of South Asian or Chinese background (using standard European thresholds). For most people without extreme muscle mass, it gives a useful first indication of whether weight is a health concern.
Last updated May 2026. NHS BMI categories are based on NICE guidelines and NHS Digital guidance. For a personal health assessment, consult your GP.