
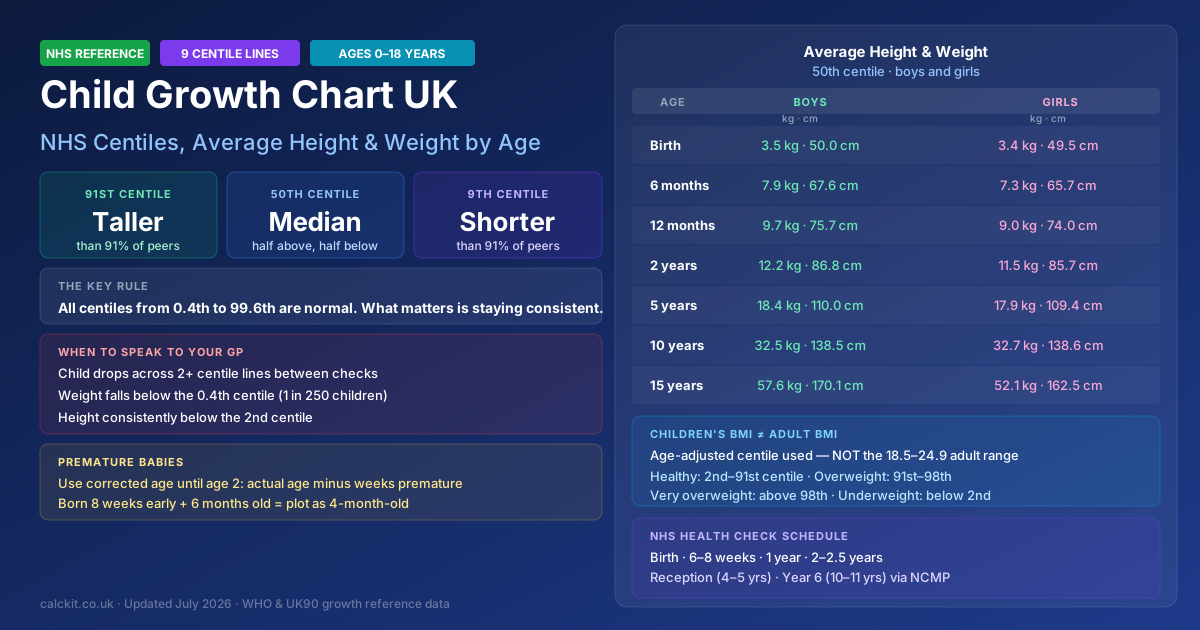
UK child growth charts tell you whether your child's height and weight are within the expected range for their age and sex — but reading them correctly requires understanding what centiles mean and, crucially, what they don't mean.
👶How UK growth charts work
UK NHS growth charts display nine curved lines called centile lines, labelled from the 0.4th to the 99.6th. These lines show the range of heights and weights among healthy UK children at each age.
The nine centile lines:
| Centile | What it means |
|---|---|
| 99.6th | Taller/heavier than 99.6% of children the same age and sex |
| 98th | Taller/heavier than 98% |
| 91st | Taller/heavier than 91% |
| 75th | Taller/heavier than 75% |
| 50th | Median — middle of the distribution |
| 25th | Taller/heavier than 25% |
| 9th | Taller/heavier than 9% |
| 2nd | Taller/heavier than 2% |
| 0.4th | Taller/heavier than 0.4% |
A child on the 9th centile for height is shorter than 91% of children their age — and this is completely normal. Two children on the 9th and 91st centile can both be in excellent health. The number is not a score.
What matters is consistency, not the centile itself. A child who has always plotted near the 9th centile is tracking their own growth pattern. A child who drops from the 75th centile to the 25th between checks is the one who warrants a closer look.
The "Red Book" (Personal Child Health Record, PCHR) given to parents at birth includes growth charts for 0–5 years. Your health visitor plots your child's measurements at each check. A second set of charts covering 5–18 years is used by schools and clinics.
Which reference data does the NHS use?
UK growth charts combine two data sources:
- Ages 0–4: WHO Child Growth Standards — based on healthy breastfed children from Brazil, Ghana, India, Norway, Oman, and the United States, describing how children should grow under optimal conditions
- Ages 4–18: UK90 data — based on UK children measured in 1990, describing how children do grow in a UK population
Both use the same nine centile lines and the same plotting approach. The transition at age 4 is seamless in the charts.
Average height and weight by age — boys (50th centile)
The 50th centile values below represent the median for UK boys on current reference charts.
| Age | Weight (50th centile) | Height (50th centile) |
|---|---|---|
| Birth | 3.5 kg | 50.0 cm |
| 3 months | 6.0 kg | 61.1 cm |
| 6 months | 7.9 kg | 67.6 cm |
| 9 months | 9.2 kg | 72.3 cm |
| 12 months | 9.7 kg | 75.7 cm |
| 18 months | 10.9 kg | 81.7 cm |
| 2 years | 12.2 kg | 86.8 cm |
| 3 years | 14.3 kg | 96.1 cm |
| 4 years | 16.3 kg | 102.9 cm |
| 5 years | 18.4 kg | 110.0 cm |
| 7 years | 22.9 kg | 121.7 cm |
| 10 years | 32.5 kg | 138.5 cm |
| 12 years | 40.3 kg | 149.1 cm |
| 15 years | 57.6 kg | 170.1 cm |
| 18 years | 70.3 kg | 177.0 cm |
Average height and weight by age — girls (50th centile)
| Age | Weight (50th centile) | Height (50th centile) |
|---|---|---|
| Birth | 3.4 kg | 49.5 cm |
| 3 months | 5.6 kg | 60.2 cm |
| 6 months | 7.3 kg | 65.7 cm |
| 9 months | 8.5 kg | 70.4 cm |
| 12 months | 9.0 kg | 74.0 cm |
| 18 months | 10.2 kg | 80.2 cm |
| 2 years | 11.5 kg | 85.7 cm |
| 3 years | 13.9 kg | 95.1 cm |
| 4 years | 15.9 kg | 102.7 cm |
| 5 years | 17.9 kg | 109.4 cm |
| 7 years | 22.4 kg | 121.8 cm |
| 10 years | 32.7 kg | 138.6 cm |
| 12 years | 41.5 kg | 151.5 cm |
| 15 years | 52.1 kg | 162.5 cm |
| 18 years | 60.0 kg | 163.8 cm |
These figures are the 50th centile median, not a target. A child at the 25th or 75th centile is healthy. Use these tables to understand the range, not to judge whether your child is "on track" relative to the average.
What falling between centile lines means
Growth is not linear — children grow in spurts. A single measurement below a centile line is much less significant than a trend across multiple checks. Here is how to interpret different patterns:
Consistent tracking (normal): A child who plots near the same centile at each check — even a low centile like the 2nd or 9th — is simply on their own growth trajectory. No action required.
Crossing one centile line (monitor): Dropping from the 25th to the 9th centile between two checks may simply reflect normal variation, illness, or a brief change in eating. Your health visitor will typically recheck in a few weeks.
Crossing two or more centile lines (seek review): Dropping from the 50th to the 9th centile, or from the 25th to below the 2nd, is a pattern that warrants a GP review. This may indicate "faltering growth" (previously called failure to thrive), which can have many causes including feeding difficulties, underlying illness, or nutritional gaps.
Consistently below the 0.4th centile (GP review): Only 1 in 250 children naturally sit at or below the 0.4th centile. A child consistently below this line should be reviewed by a GP, though in many cases the child is simply reflecting a family growth pattern.
Premature babies: corrected age
Premature babies (born before 37 weeks gestation) develop on a different timeline. Plotting them by actual age would make them appear smaller than expected — because they are, relative to their gestational stage.
Corrected age formula:
Corrected age = Actual age − (40 weeks − gestational age at birth)
Example: A baby born at 32 weeks (8 weeks early) who is now 6 months old:
- Corrected age = 6 months − 8 weeks = approximately 4 months
- Plot them on the 4-month point of the growth chart
Use corrected age until your child is 2 years old. By age 2, most premature babies have caught up with their peers and the correction is no longer needed. Your health visitor will guide you on when to transition to actual age.
NHS health check schedule
UK children have their growth measured at several standard points:
| Age | Check | Who |
|---|---|---|
| Birth | Weight, length, head circumference | Midwife |
| 6–8 weeks | Weight check, developmental review | GP / health visitor |
| Around 1 year | Weight, length check | Health visitor |
| 2–2.5 years | Two-year developmental review | Health visitor |
| Reception year (4–5 yrs) | Height and weight (NCMP) | School nurse |
| Year 6 (10–11 yrs) | Height and weight (NCMP) | School nurse |
The National Child Measurement Programme (NCMP) screens all children in Reception and Year 6. Results are sent home. The purpose is to identify children at the extremes of the weight range — not to compare individual children to classmates.
Children's BMI is different from adult BMI
In adults, a BMI of 18.5–24.9 is the healthy range. Children do not use the same thresholds. A child's BMI changes significantly with age — a BMI of 20 might be healthy in a 14-year-old and overweight in a 7-year-old.
For children, BMI is plotted on age and sex-specific centile charts, not compared to a fixed number. The NHS uses the following broad categories for children aged 2–18:
| Category | BMI centile |
|---|---|
| Underweight | Below 2nd centile |
| Healthy weight | 2nd to 91st centile |
| Overweight | 91st to 98th centile |
| Very overweight (obese) | Above 98th centile |
These thresholds are used for population monitoring, not clinical diagnosis. A GP would assess a child's health across multiple factors, not BMI alone.
⚕️Head circumference
For babies and young children, the growth chart also includes head circumference (HC). The head should grow at a consistent rate from birth. Head circumference tracking is most important in the first year of life.
Concerns are raised if:
- Head circumference is consistently below the 2nd centile
- Head circumference crosses centile lines downward (possible microcephaly)
- Head circumference grows unusually rapidly (possible hydrocephalus)
Your midwife and health visitor measure head circumference at routine checks. If they have concerns, they will refer your child to a paediatrician.
When to speak to your health visitor or GP
Contact your health visitor or GP if:
- Your child's weight drops across two or more centile lines between any two measurements
- Your child's weight is consistently below the 0.4th centile
- Your child's height is consistently below the 2nd centile
- You notice a sudden change in appetite, energy levels, or thirst
- Your child seems unwell or has had unexplained weight loss
- Your baby is feeding poorly or seems unsatisfied after feeds
- You are concerned about growth for any reason — health visitors are there to help
A single low reading is rarely cause for alarm. Growth charts are meant to be read as a trend across multiple measurements over time, not as a one-off snapshot. If in doubt, your health visitor is the first point of contact.
Child growth chart quick reference
| Centile | 1 in X children | Status |
|---|---|---|
| Below 0.4th | 1 in 250 | GP review recommended |
| 0.4th–2nd | 1 in 50 | Monitor; may be normal |
| 2nd–9th | 1 in 11 | Normal lower range |
| 9th–91st | Most children | Normal healthy range |
| 91st–98th | 1 in 11 | Normal higher range |
| 98th–99.6th | 1 in 50 | Monitor; may be normal |
| Above 99.6th | 1 in 250 | GP review recommended |
The most important thing to remember: a centile is not a target, it is a reference point. A child who has always grown along the 9th centile is tracking beautifully. The chart exists to flag unexpected changes — not to suggest that children at the lower centiles need to gain weight or that children at the upper centiles need to lose it.