
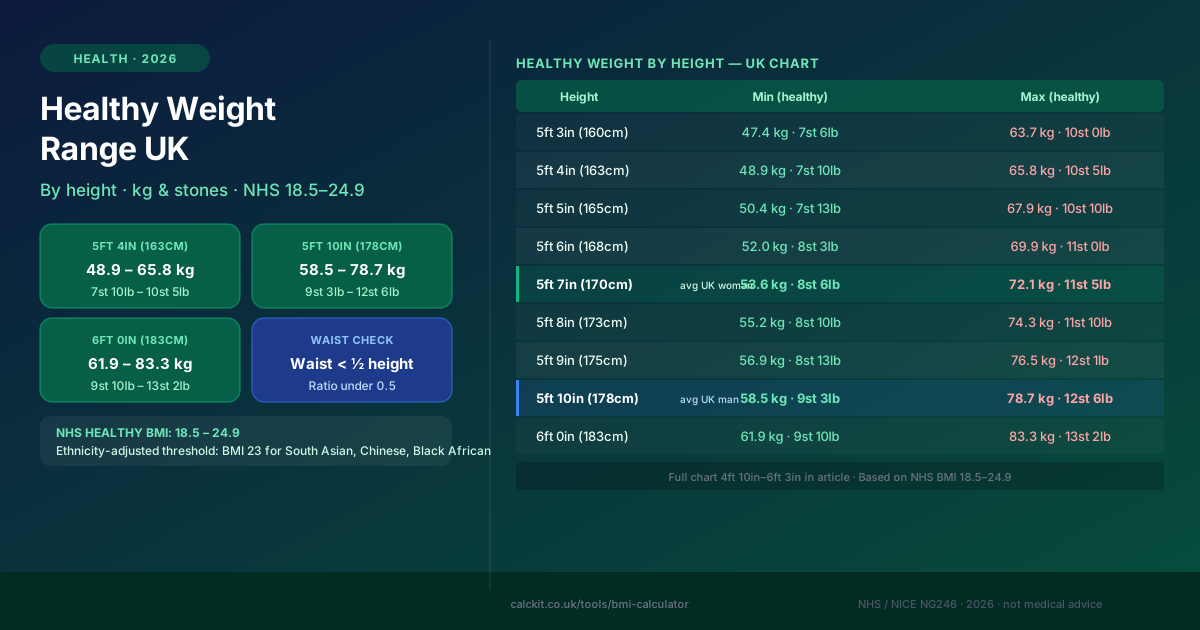
At 5ft 4in, a healthy weight is anywhere from 48.9 to 65.8 kilograms — a range of nearly 17 kg, or about 2 stone 9 pounds. At 5ft 10in, that range stretches from 58.5 to 78.7 kg.
Most people know they are supposed to be a "healthy weight," but the specific numbers rarely come up. When they do, they tend to arrive at a GP's desk or on a slimming club chart that shows only stones, or only kilograms, and only after you've had to do some maths.
This article gives you the full NHS-based chart by height — in both kilograms and stones — plus the waist check that is increasingly considered more useful than BMI alone, and the cases where the standard chart does not apply.
⚕️The UK healthy weight chart by height — kg and stones
The NHS defines a healthy weight as a Body Mass Index (BMI) between 18.5 and 24.9. The table below converts that range into actual weight figures for heights from 4ft 10in to 6ft 3in.
All figures are for adults aged 18 to 65. For ethnicity-adjusted ranges, see the section below. These figures do not apply during pregnancy.
| Height | Min healthy weight | Max healthy weight |
|---|---|---|
| 4ft 10in (147cm) | 40.1 kg (6 st 4 lb) | 54.0 kg (8 st 7 lb) |
| 4ft 11in (150cm) | 41.6 kg (6 st 8 lb) | 56.0 kg (8 st 11 lb) |
| 5ft 0in (152cm) | 43.0 kg (6 st 11 lb) | 57.8 kg (9 st 1 lb) |
| 5ft 1in (155cm) | 44.4 kg (6 st 14 lb) | 59.7 kg (9 st 6 lb) |
| 5ft 2in (158cm) | 45.9 kg (7 st 3 lb) | 61.8 kg (9 st 10 lb) |
| 5ft 3in (160cm) | 47.4 kg (7 st 6 lb) | 63.7 kg (10 st 0 lb) |
| 5ft 4in (163cm) | 48.9 kg (7 st 10 lb) | 65.8 kg (10 st 5 lb) |
| 5ft 5in (165cm) | 50.4 kg (7 st 13 lb) | 67.9 kg (10 st 10 lb) |
| 5ft 6in (168cm) | 52.0 kg (8 st 3 lb) | 69.9 kg (11 st 0 lb) |
| 5ft 7in (170cm) | 53.6 kg (8 st 6 lb) | 72.1 kg (11 st 5 lb) |
| 5ft 8in (173cm) | 55.2 kg (8 st 10 lb) | 74.3 kg (11 st 10 lb) |
| 5ft 9in (175cm) | 56.9 kg (8 st 13 lb) | 76.5 kg (12 st 1 lb) |
| 5ft 10in (178cm) | 58.5 kg (9 st 3 lb) | 78.7 kg (12 st 6 lb) |
| 5ft 11in (180cm) | 60.1 kg (9 st 6 lb) | 80.9 kg (12 st 10 lb) |
| 6ft 0in (183cm) | 61.9 kg (9 st 10 lb) | 83.3 kg (13 st 2 lb) |
| 6ft 1in (185cm) | 63.6 kg (10 st 0 lb) | 85.6 kg (13 st 7 lb) |
| 6ft 2in (188cm) | 65.4 kg (10 st 4 lb) | 88.0 kg (13 st 12 lb) |
| 6ft 3in (190cm) | 67.1 kg (10 st 8 lb) | 90.4 kg (14 st 3 lb) |
These figures are based on the NHS BMI thresholds of 18.5 (lower healthy limit) and 24.9 (upper healthy limit), and are calculated using metric heights converted from imperial. Weights are rounded to one decimal place.
To find your precise BMI and see exactly where you sit within the range, use the CalcKit BMI calculator — it shows your result against all four categories and flags whether ethnicity-adjusted thresholds apply to you.
What the BMI categories mean
| BMI | Category |
|---|---|
| Below 18.5 | Underweight |
| 18.5 to 24.9 | Healthy weight |
| 25.0 to 29.9 | Overweight |
| 30.0 to 39.9 | Obese |
| 40 or above | Severely obese |
A BMI at the lower end of healthy (18.5 to 21) is not "better" than one in the middle. The healthy range is wide because bodies vary significantly in build, bone density, and composition. Aiming for a specific number within the range — rather than simply staying within it — often leads to unnecessary restriction.
The waist check: more useful than BMI for many people
BMI has a well-known limitation: it measures total weight relative to height, not where that weight sits. Two people can have the same BMI but very different health risks depending on how much fat they carry around their abdomen.
The NHS and NICE (updated guidance NG246, 2025) recommend checking your waist-to-height ratio alongside BMI, particularly if your BMI is between 25 and 35.
The rule: keep your waist measurement to less than half your height.
Waist-to-height ratio = waist (cm) ÷ height (cm)
A ratio under 0.5 is the target. Above 0.5 indicates increased health risk.
| Waist-to-height ratio | Health risk |
|---|---|
| Under 0.4 | Low (may indicate underweight) |
| 0.4 to 0.49 | Healthy |
| 0.5 to 0.59 | Increased risk |
| 0.6 or above | High risk |
How to measure your waist correctly:
- Find the midpoint between the bottom of your lowest rib and the top of your hip bone
- Wrap a tape measure around this point, keeping it level and horizontal
- Breathe out naturally (don't pull in your stomach)
- Take the measurement
NHS absolute waist thresholds:
| Sex | Low risk | High risk |
|---|---|---|
| Men | Under 94 cm (37 in) | Above 102 cm (40 in) |
| Women | Under 80 cm (31.5 in) | Above 88 cm (34.6 in) |
If your BMI is in the healthy range but your waist-to-height ratio is above 0.5, the NHS recommends speaking to your GP, as central fat (around the abdomen) is more closely linked to type 2 diabetes, high blood pressure, and cardiovascular disease than overall weight.
⚡Ethnicity-adjusted healthy weight thresholds
The standard chart above applies to most adults with a white European background. For people of South Asian, Chinese, Black African, and African-Caribbean heritage, the NHS uses lower thresholds because research shows these groups tend to accumulate harmful visceral fat at a lower BMI.
| BMI | Standard category | Category for South Asian, Chinese, Black African, African-Caribbean |
|---|---|---|
| Below 18.5 | Underweight | Underweight |
| 18.5 to 22.9 | Healthy | Healthy |
| 23.0 to 27.4 | Healthy → Overweight | Overweight |
| 27.5 to 29.9 | Overweight | Obese |
| 30 and above | Obese | Obese |
What this means in practice: A person of South Asian heritage who is 5ft 6in and weighs 74 kg has a BMI of about 26.3. Under the standard chart, that sits in the overweight range. Under the ethnicity-adjusted thresholds, it falls in the obese range — and carries the health risks associated with that category.
If you fall into one of these ethnic groups, the NHS recommends using the lower thresholds when discussing weight with your GP or practice nurse.
When the healthy weight chart does not apply
Athletes and muscular people
BMI cannot distinguish between muscle and fat. A competitive rugby player, professional cyclist, or regular weightlifter may have a BMI of 27 or 28 while carrying very low body fat — and their cardiovascular health may be excellent. In these cases:
- Waist-to-height ratio is more informative than BMI
- Body fat percentage (measured by DEXA scan, hydrostatic weighing, or skinfold calipers) gives a direct reading of fat mass vs lean mass
- A GP or sports medicine professional can interpret BMI in context
Older adults (over 65)
The NHS healthy weight range is designed for adults aged 18 to 65. Some evidence suggests that for older adults, a BMI of 25 to 27 may be acceptable — and that being slightly above the standard "healthy" range may be protective, because lower body weight in older age is associated with reduced muscle mass (sarcopenia), weaker bones, and increased fracture risk.
If you are over 65, discuss your weight with your GP rather than targeting the lower end of the NHS chart.
Pregnancy
BMI-based healthy weight ranges do not apply during pregnancy. Weight naturally increases through pregnancy and varies significantly based on factors the NHS does not assess via BMI. If you have concerns about weight during pregnancy, speak to your midwife.
Children and teenagers
BMI is calculated differently for children and teenagers (ages 2 to 17), using age and sex-adjusted centile charts rather than fixed thresholds. The NHS children's BMI calculator uses centiles based on UK growth reference data. The adult healthy weight chart on this page does not apply to anyone under 18.
Healthy weight is a range, not a number
The most useful frame for thinking about weight is whether you are within the range — not where within the range you sit. There is no evidence that a BMI of 19 is healthier than a BMI of 23, or that aiming for the lower end of the healthy range produces better health outcomes than staying in the middle.
What the research does consistently show is that:
- Moving from outside the range (either direction) into the healthy range improves health outcomes
- Waist-to-height ratio is a better predictor of metabolic risk than BMI alone
- Small changes in behaviour (diet, physical activity) often produce weight changes over weeks and months, not days
If your current weight is outside the healthy range for your height, speaking to your GP, a registered dietitian, or NHS Weight Management Services is more effective than using a chart as a daily target.
🔥Healthy weight ranges for common UK heights — worked examples
Emma, 5ft 4in, 11 stone (69.8 kg)
BMI = 69.8 ÷ (1.626²) = 26.4 → overweight by NHS standards. Her healthy range is 48.9–65.8 kg. She is about 4 kg above the upper limit. Waist-to-height check: if her height is 163cm, she should aim for a waist under 81.5 cm. If her waist is under that, her health risk from the extra weight is lower.
James, 6ft 0in, 13 stone 7 lb (85.7 kg)
BMI = 85.7 ÷ (1.829²) = 25.6 → just into overweight. His healthy range is 61.9–83.3 kg. He is about 2.4 kg above the upper limit. Given he lifts weights three times a week, his GP would likely assess waist measurement and overall health markers rather than treating the BMI number in isolation.
Priya, 5ft 3in, 10 stone (63.5 kg)
BMI = 63.5 ÷ (1.600²) = 24.8 → within the standard healthy range. However, Priya is of South Asian heritage — using the ethnicity-adjusted threshold of 23, her BMI of 24.8 falls in the overweight category and warrants a conversation with her GP about metabolic risk.
Key figures at a glance
| Measure | Healthy threshold |
|---|---|
| BMI (most adults) | 18.5 to 24.9 |
| BMI (South Asian, Chinese, Black African, African-Caribbean) | 18.5 to 22.9 |
| Waist-to-height ratio | Under 0.5 |
| Waist — men | Under 94 cm |
| Waist — women | Under 80 cm |
| BMI range applies | Adults 18–65, non-pregnant |
Last updated October 2026. BMI categories from NHS England. Ethnicity-adjusted thresholds from NHS obesity diagnosis guidance (updated 2026). Waist-to-height ratio guidance from NICE NG246 (January 2025, updated 2026). This article is for informational purposes only — for personal health advice, speak to your GP or a registered dietitian.